Profiling JVM applications inside containers
Measuring and profiling applications are one of those things you normally don’t do when when you need to do it is kind of a magical black art, especially if you are (like me) one of those persons who really love to move and do all your development and work in containers. Do you want to see how your JVM application is doing in a container orchestration and see if those small “tweaks” you did made a difference? Well, I recently had to and this is my simple blog post to remind me in the future what I need to do so I don’t spend time again searching in the web.
First, we need a good JVM profilers, there are plenty out there but personally I got used to VisualVM, a free tool integrating a bunch of command line stuff to do profiling and troubleshooting, go and grab it, it works in macOS, Linux and Windows.
One thing I have to point out is that VisualVM needs a JDK installed and it does not detects it automatically, so you have to configure the file visualvm.conf file (located in the etc folder) and set the visualvm_jdkhome value with the full path of your JDK (this does not necessarily needs to be the same path as the JRE you are going to profile).
Now it is time to configure your container to be profiled, imagine this is the current entrypoint of your container: java -jar app.jar, we now need to “slightly” modify the entrypoint to allow profiling by VisualVM, the following parameters need to be added:
-Dcom.sun.management.jmxremote=trueactivate the remote JMX (Java Management eXtensions) endpoint-Dcom.sun.management.jmxremote.port=8849tells the port we are going to use for remote JMX-Dcom.sun.management.jmxremote.local.only=falseyep, this is just for local profiling but without this we won’t be able to connect to the container (remember, it is “like” running in a separate machine)-Dcom.sun.management.jmxremote.authenticate=falseof course we don’t want to authenticate, this is for our local profiling!-Dcom.sun.management.jmxremote.ssl=falseno SSL, again, this makes sense when you are profiling a docker app in your machine-Djava.rmi.server.hostname=localhostwe are setting the Java RMI (Remote Method Invocation) server to localhost-Dcom.sun.management.jmxremote.rmi.port=8849again, the same port for JMX is used for RMI
Of course we need to expose the port 8849 as well to make all of this work, to simplify running the application I simply use a docker-compose.yml file instead of writing a lot in the command line all the time for profiling:
version: '3'
services:
    app:
        build: .
        ports:
            - 8849:8849
        entrypoint:
            - java
            - "-jar"
            - "-Dcom.sun.management.jmxremote=true"
            - "-Dcom.sun.management.jmxremote.port=8849"
            - "-Dcom.sun.management.jmxremote.ssl=false"
            - "-Dcom.sun.management.local.only=false"
            - "-Dcom.sun.management.authenticate=false"
            - "-Djava.rmi.server.hostname=localhost"
            - "-Djcom.sun.management.jmxremote.rmi.port=8849"
            - app.jar
Of course, feel free to add as many other parameters you need, but this is the minimum I needed to do the local profiling inside a container.
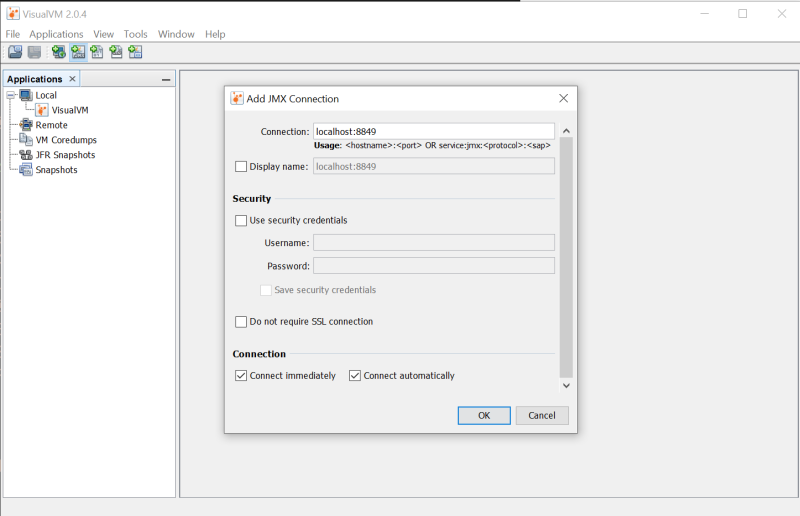
Now it is time to run the container or orchestration and start profiling, run the orchestration with docker-compose up -d in the directory where your docker-compose.yml file is and then start VisualVM and select “Add JMX host…” in the main menu (or the weird third icon in the UI):
Done! now you can go crazy and apply your stress test to your application and see how it goes, it is basically like profiling locally but using a container, or in my case, a whole orchestration. Happy profiling!